I wanted a simple way for anyone to check if my services are up — without exposing my internal monitoring. So I set up a public status page at status.pavlohorniak.me, powered by Uptime Kuma, self-hosted on my Raspberry Pi.
Why a Status Page?
I run several public-facing services — my portfolio, a personal API, a fitness dashboard, and a homepage dashboard. They're all hosted on a Raspberry Pi behind a Cloudflare Tunnel. If something goes down, I want to know immediately — and I want others to be able to check without asking me.
Uptime Kuma was already running privately on my Pi, monitoring everything from Pi-hole to Docker containers. The missing piece was making a curated, public-facing view of just the services that matter to visitors.
The Setup
Uptime Kuma
Uptime Kuma is an open-source, self-hosted monitoring tool. It runs as a single Docker container and provides HTTP(s), TCP, DNS, and ping monitoring with a clean UI. I've been running it for months to track all my homelab services.
Prerequisites
If you're starting from a fresh Raspberry Pi (or any Debian-based system), you'll need Docker installed first:
# Update system packages
sudo apt update && sudo apt upgrade -y

# Install Docker via the official convenience script
curl -sSL https://get.docker.com | sh

# Add your user to the docker group (no sudo needed for docker commands)
sudo usermod -aG docker $USER

# Log out and back in, then verify
docker --version
Running with Docker
With Docker ready, deploying Uptime Kuma takes a single command:
docker run -d \
  --name uptime-kuma \
  --restart unless-stopped \
  -p 3002:3001 \
  -v /home/pavlusha/uptime-kuma:/app/data \
  louislam/uptime-kuma:latest
That's it. Port 3001 inside the container is mapped to 3002
on the host (since 3001 was already taken). The data volume persists all monitors,
status pages, and notification settings across restarts. With --restart unless-stopped,
it comes back automatically after a reboot.
Once running, the dashboard is available at http://192.168.1.216:3002.
First launch prompts you to create an admin account — after that, you can start adding
monitors for your services.
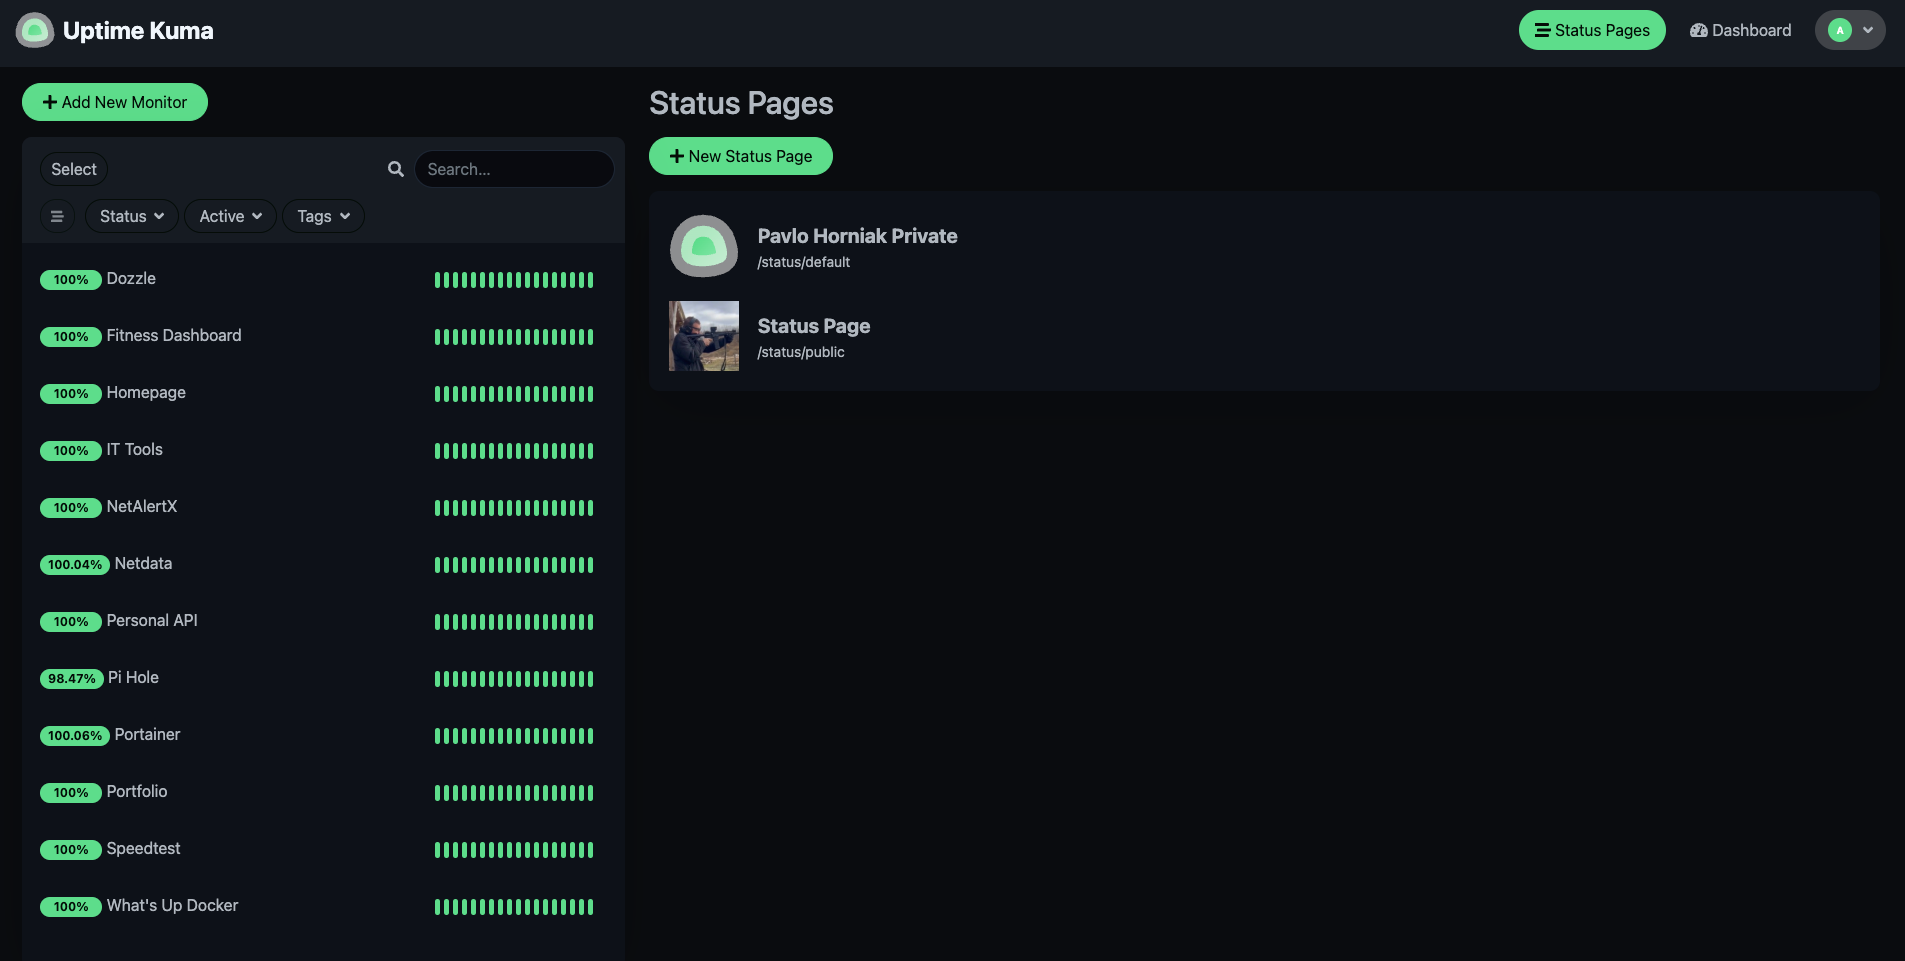
The key feature here is Status Pages — Uptime Kuma lets you create separate public pages with only the monitors you choose. The private dashboard stays behind authentication while the public page is open to anyone.
Creating the Public Page
In Uptime Kuma, I created a new Status Page with the slug public and added
only the four public-facing services:
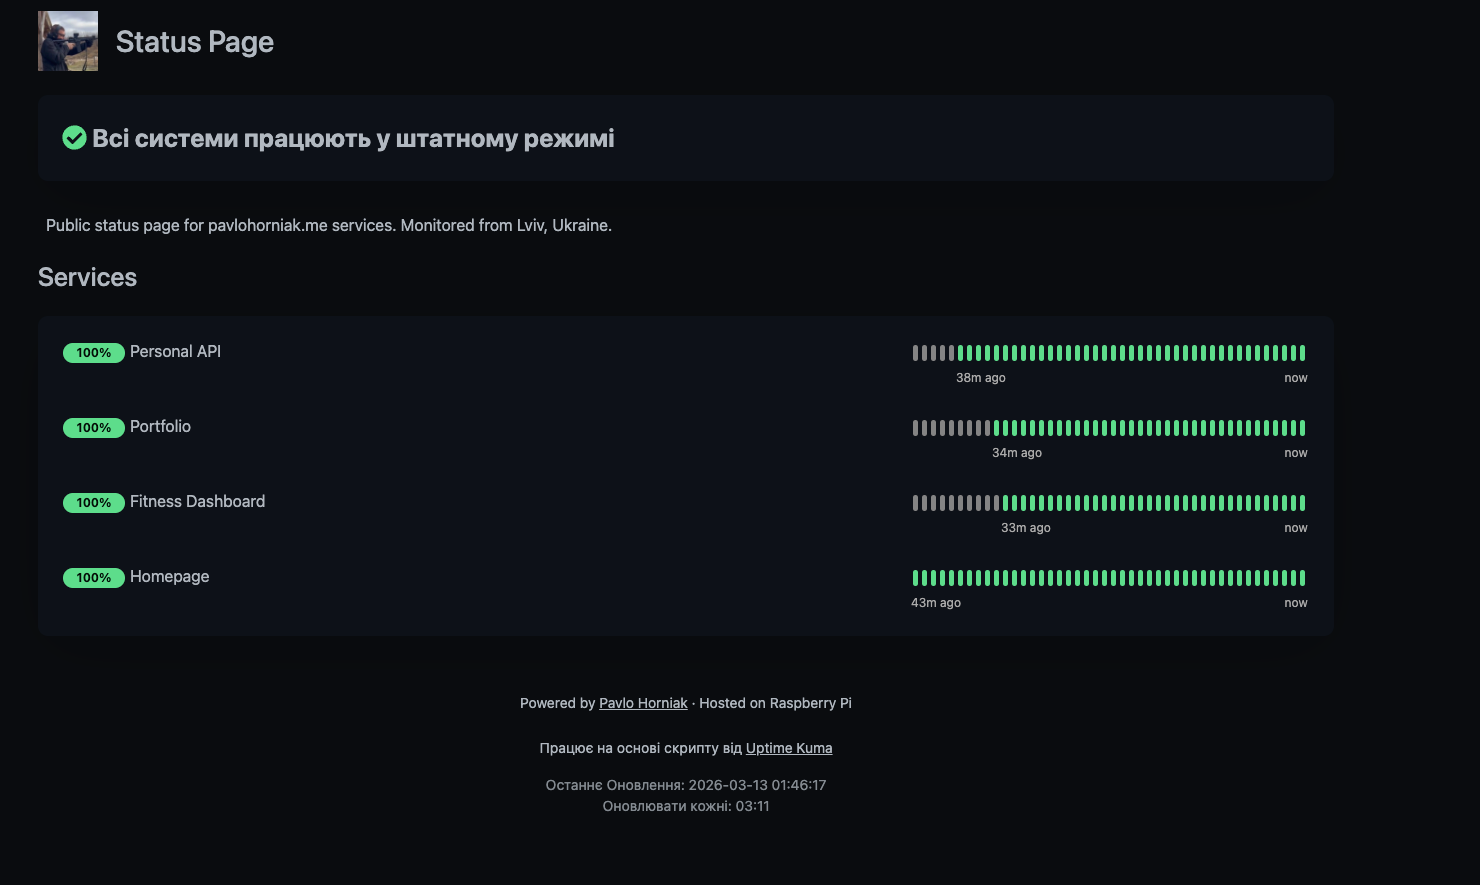
- Portfolio — pavlohorniak.me
- Personal API — api.pavlohorniak.me
- Fitness Dashboard — fitness.pavlohorniak.me
- Homepage — home.pavlohorniak.me
I also added custom CSS to match my portfolio's dark theme — same background colors, accent gold, rounded cards, and font styles. It feels like a natural extension of the site rather than a separate tool.
Nginx Reverse Proxy
Uptime Kuma runs on port 3002, but I didn't want to expose the full application publicly. The login page, settings, and private monitors should stay locked down. So I set up an Nginx config that only proxies the public status page and its required assets:
server {
    listen 80;
    server_name status.pavlohorniak.me;

    location = / {
        return 301 https://status.pavlohorniak.me/status/public;
    }

    location /status/public {
        proxy_pass http://localhost:3002;
        ...
    }

    location /assets { proxy_pass http://localhost:3002; }
    location /upload { proxy_pass http://localhost:3002; }
    location /socket.io { ... }
    location /api/status-page { proxy_pass http://localhost:3002; }

    location / { return 403; }
}
The root URL redirects to the public page. WebSocket support is included for real-time
updates. Everything else returns a 403 Forbidden. The private dashboard
is only accessible from the local network.
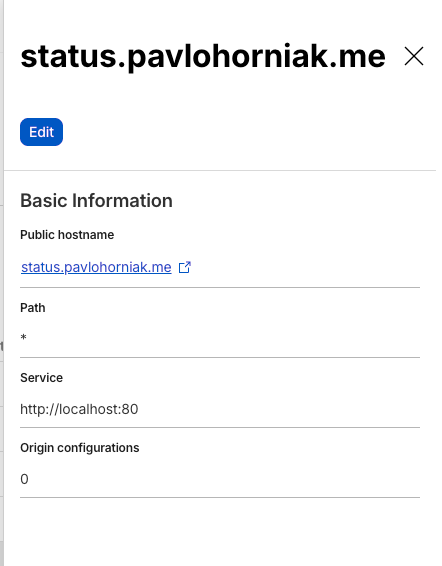
Cloudflare Tunnel
The final step was adding a route in my existing Cloudflare Tunnel to point
status.pavlohorniak.me to http://localhost:80 on the Pi.
Cloudflare handles SSL termination and caching. No ports opened on the router,
no certificates to manage.
The Result
The status page is now live at status.pavlohorniak.me. It shows real-time uptime percentages, heartbeat history, and an overall status indicator. If any service goes down, the page reflects it immediately.
I also added a link in my portfolio's footer — every page now has a "Status Page" link with a styled tooltip, so visitors can check service health anytime.
Stack Summary
| Component | Role |
|---|---|
| Uptime Kuma | Monitoring & public status page |
| Nginx | Reverse proxy with selective path exposure |
| Cloudflare Tunnel | Secure external access, SSL |
| Raspberry Pi 5 | Self-hosted infrastructure |
| Docker | Container runtime |
What's Next
The status page is intentionally minimal — just the essentials. A few things I might add later:
- Notification integrations (Telegram bot for downtime alerts)
- Incident history and maintenance windows
- Response time graphs on the public page
The whole setup took about 30 minutes — most of it was getting the Nginx config right to expose only the public page. If you're already running Uptime Kuma, adding a public status page is a no-brainer.